Is richness of local tropical butterfly faunas underestimated? Perspectives gained from biases in transect observations.
Peter B. HARDY1, Roger. L. H. DENNIS2,3
1.81 Winstanley Road, Sale, Cheshire M33 2AT, U.K.
2.School of Biological and Molecular Sciences, Oxford Brookes University, Headington, Oxford OX3 0BP, U.K. and The Manchester Museum (Entomology), Manchester University, Oxford Road, Manchester M13 9PL, U.K.
3 Corresponding author. 4 Fairfax Drive, Wilmslow, Cheshire SK9 6EY, U.K. E-mail: rlhdennis@aol.com
Abstract We use cumulative species records of butterflies from transects collected locally at Calumpang Lejos (Indang, Cavite) on Luzon, Philippines, to test whether inventories of taxa underestimate local species richness and diversity. No limit emerges in species cumulative curves despite 457 transects carried out over two years, including 340 hours of observation. Jackknife estimates, biased recording, and local variation in richness, relative abundances and diversity associated with contrasts in biotopes, all support the notion of the richness of local butterfly faunas being underestimated. Bias was recorded locally in transect records for abundance and colour pattern. This bias was mirrored for find dates and dates of scientific naming for the same species, as well for all species found on Luzon and throughout the Philippines and extended to butterfly size. Less abundant, smaller and duller species are discovered significantly later. Bias is taxonomically based; Hesperiidae and Lycaenidae have significantly later find dates and scientific naming dates than Papilionidae, Pieridae and Nymphalidae and are also significantly less abundant, smaller and duller. Biased recording may be exacerbated by the reinforcement of physical apparency: species with less apparent wing patterns tend to be smaller. It was found that rarer species were significantly smaller and duller for Luzon and at Calumpang Lejos. As bias for the local transects involves Lycaenidae but not Hesperiidae, it is suggested that bias, in this study, is caused by under-recording of canopy species. The implications for faunal inventories of other organisms and conservation of tropical butterflies are discussed; there is a need for new techniques, which account for bias, to provide suitable estimates of species richness from faunal samples.
Key words butterflies, recording, tropics, Philippines, bias, diversity, species richness
Richness of butterfly faunas is experienced by individuals at a locality scale, not at the scale of a state or country, and an increasing priority is to encourage individuals to invest in conserving their local diversity. In temperate regions, detailed distribution mapping provides essential data at progressively finer scales, but even there resolution rarely exceeds 1km squares (e.g., United Kingdom, Dennis, 1992; Asher et al., 2001; Cowley et al., 2001). Understandably, in tropical regions, in view of the extensive faunal diversity and lack of availability of resources for monitoring biodiversity, mapping of organisms has yet to develop. Biodiversity is typically recorded for larger areas such as states or large islands, otherwise biologists are reliant on sparse local lists (e.g., Daily and Ehrlich, 1995; Danielsen and Treadaway, 2004) often collated from brief visits. Yet, it is at a locality scale that plant and animal diversity becomes relevant to individuals and it is at this scale that loss in biodiversity first becomes noticeable and conservation practices are enacted (New, 1997). It is at this scale that we need to demonstrate that conservation practices can be effectively integrated into everyday life.
With the availability of local lists of species, the question then arises as to just how representative local faunas are of the grander picture of the nation state, region or island? What proportion of a regional fauna can one expect to record? Particularly, just how effective is the local recording of species in a tropical context? Are there aspects of the recording methodology, such as elements of bias in recording, which conceal failure to record the fauna evenly? Local recording has certainly been successful in temperate latitudes using the transect methods of the “Butterfly Monitoring Scheme” developed by Dr E. Pollard in the U.K (Pollard and Yates, 1993; Stefanescu et al. 2003). Even here, however, there are exceptions such as difficulty in recording high tree species (e.g., Neozephyrus quercus L. Lycaenidae); does this, however, translate into greater difficulties in a tropical context, i.e., are there more high tree species or high flying species that are difficult to determine against the backcloth of far greater butterfly and plant species diversity in the tropics? Recent tests in Brazil, comparing transect observations with collecting, suggest that transect observations could provide a valuable and accurate supply of data on butterflies in tropical rain forests (Caldas and Robbins, 2003).
The standard technique for accumulating a local list of species is to apply repeated sampling over a fixed area. From this is generated a cumulative distribution of species incidence against numbers of surveys (Krebs, 1989). The lists tend to grow with time and typically there is expectation of a distinct fall off to numbers of new species (Krebs, 1989) if not an asymptote in log-log axes (Williamson et al. 2001). Alternatively, ‘plateaux’ or ‘benches’ may occur in the distribution curve only to be followed by a resumption of increased diversity with repeated survey. Studies from Alderley Edge (Cheshire, U.K.), using the presence and absence of hostplants as a habitat indicator, demonstrate that a cumulative and continuous rise in species with survey number occurs owing to the incursion of vagrants (Dennis, 2001). Further incursions can occur over the medium term (years) owing to changes in biotopes and resources for organisms, for instance associated with vegetation succession and management (Davis 1989). Lack of an asymptote in cumulative species curves, in itself, does not present an insuperable problem for determining local faunas as the incidence and frequency of indigenous elements will tend to rise with repeated survey and the incursion of each vagrant species will be relatively infrequent. Even so, local lists of species may tend to overestimate indigenous species diversity.
Countering this, local lists may actually underestimate species diversity, regardless of the number of surveys. At least two prominent reasons are suggested: (i) species’ apparency and (ii) spatial diversity. A shortfall of species in local lists from either of these factors should be evident in the form of biased records. Species’ apparency varies in several ways, relating to differences in abundance (density), size, wing colour or pattern, behaviour and substrate use. Any bias in species recording for visual apparency, including colour or pattern, size and abundance, will generally indicate that species are being missed, typically the less striking, smaller and rarer species. Observations on more abundant species will tend to detract from those made on rarer species; this is exacerbated by the fact that numbers of common species can be confused and therefore observation must necessarily be made of all individuals seen during recording. Behavioural bias is more difficult to determine; it incorporates biotope or substrate associations, species under-recorded tending also to be those with more secretive habits or flying in inaccessible vegetation strata (Dennis, 2004). Distinctions in behavioural apparency, as those for physical apparency, will tend to result in taxonomic bias; under-recorded taxa will again tend to be less apparent in one respect or another. Apparency will influence not only the recording of species on transects but should influence the date when species were first found and described. Thus, an association is anticipated between the taxa recorded on transects, perhaps even the order in which they are recorded if recorder acuity develops with survey number, and the date of recording taxa over the wider region that includes the locality.
Species, dependent on different ‘resources’ often referred to collectively as ‘habitats’ (Dennis et al., 2003), are typically associated with particular biotopes. Localities with a diversity of biotopes will generally record more species than those with few biotopes (Krebs, 1989; Hill and Hamer, 2004). Thus, the incidence of species on local lists is spatial scale-dependent and will reflect how adequately variation in biotopes has been sampled for a target spatial unit. Contrasts between lists for different sample points or transects are indicative of small-scale variation in resources and biotopes and will tend to persist despite any increasing similarity in lists owing to incursions of vagrants (Dennis, 2001).
Here, we present data for three localities in Luzon in the Philippines. Over 900 species have been recorded for the Philippines, a figure that is rising steadily (Danielsen and Treadaway, 2004); 435 of these occur on the main island, Luzon (Treadaway, 1995). The distribution of species over butterfly families and subfamilies is recorded in Table 1 and the species recorded during the survey are listed in Appendix 1. Using data from these three localities we ask a number of questions: 1. How representative is a local butterfly fauna of fauna for a wider region, in this case Luzon? 2. Do the species recorded locally by a standard transect technique tend to form a biased sample of those over the wider region? 3. What is the impact of sample points selected (transect location) on local butterfly inventories?
1 Materials and methods
1.1 Study areas
Records of butterfly species were collected in three neighbouring localities from January 2001 to September 2002 in the vicinity of Calumpang Lejos, Indang, Cavite, in and around the new development known as ‘Indang Village’: (N14.13o, E120.50o; area 20 square km): (i) ‘Indang Village’ itself (1.25 square kilometres), (ii) extensive secondary forest with extensive fruit growing to the north and east of and adjoining Indang Village and (iii) a mixture of roadside houses, gardens, orchards and open farmland with scattered settlement in Calumpang Lejos, to the west of the Indang Village. Table 2 lists details of the three main localities around Indang Village.
1.2 Procedures
In each of the localities, records were obtained along a transect route walked at a constant pace (Pollard and Yates, 1993) by one of us (PBH); Observations were made on butterflies entering a box of 10m width (5m either side of the observer) by 5m in front of the observer without restriction to height. The total area over which observations were carried out was approximately 88,000 square metres (8.8km by 10m). Survey time and the number of survey days are provided in Table 2; the maximum distance between transect routes is 4 km. Specimens of uncertain species were photographed and not captured. Some additional records for Metro Manila, referred to for comparison, represent more casual observations for 60 days over a much longer time period from 1988 to 2002.
Specific questions are examined to determine whether local butterfly recording underestimates species richness:
(i) What proportion of the regional butterfly fauna for Luzon can be found at a single locality? It is anticipated that this will be a small fraction and attain a finite limit (flatten out in untransformed axes) after sampling by repeated surveys through two years. The reasoning behind this expectation is that although tropical species may be ubiquitous, specialisation will tend to cause contrasts in incidence and abundance at the local scale. A comparison is made of the list of species recorded for the Indang transects and the list for the island of Luzon. This comparison depends on the number of surveys conducted at Indang and their seasonal timing.
(ii) Do the butterfly records for a locality represent a biased sample of the butterfly fauna for the surrounding region of Luzon thereby suggesting that repeated sampling is underestimating richness? Bias in local butterfly recording at Indang is examined for taxa (family), abundance, size and wing pattern by comparing species recorded on the three transect routes at Indang against those not recorded but occurring on the island of Luzon. Reasons for using Luzon species as a comparative base are given below. Homogeneity between the two data sets is indicative of lack of any bias.
Nomenclature and taxonomy (families, subfamilies) are taken from Treadaway (1995) and D’Abrera (1981-1986). Abundance categories (1 very rare, 2 rare, 3 uncommon or local, and 4 common) are taken from Treadaway (1995). Size and pattern details are extracted directly from life-size photographs in D’Abrera (1981-1986), De Jong & Treadaway (1993), Eliot (1992) and Treadaway (1995); size, forewing wing expanse from base to apex (mm), was recorded in 7 size bands (1 = 10 to 19mm, 2 = 20 to 29mm, etc). Wing pattern was scored for 5 bands (from 1 very dull to 5 very bright, based on five model species; 1. Psolos fuligo, 2 Euploea mulciber, 3, Neptis mindorana, 4, Junonia almana, 5 Appias olferna) by one of us (PBH) and tested by an independent observer (Phillip M. Kinder). The two correlated very highly and significantly (Gamma = 0.96, P < 0.00001).
(iii) Are local records influenced by the selection of sampling points? In other words, are there significant differences in richness and diversity associated with changes in small spatial scale changes in biotopes, resources and substrates within a single locality? Differences in richness between localities (transect routes) at Indang are determined using jackknife estimates for the three transects based on amalgamated surveys for 2h periods (Krebs, 1989). A jackknife estimator is recommended when the number of surveys is small (<20) and a bootstrap estimator when the number of surveys is large (Krebs, 1989). Transect 3 has only been surveyed 15 times and a jackknife estimator is regarded as most suitable. Differences in relative abundances for taxa are tested across transects using ANOVA. Diversity or heterogeneity between transect data is examined by applying principal components analysis on relative frequencies for species with ³20% incidence on any one transect; the cutoff in frequencies is used to avoid the influence of vagrants.
Ideally, comparisons for biased recording at Indang would be made against a long term inventory for the immediate surrounds of the village from all biotopes. As this is not possible, butterflies from the wider frame of Luzon are used. In comparing data for Indang and Luzon, we assume that, although species’ geographical distributions will vary over the island, similar frequency distributions in butterfly wing pattern, size, abundance and taxa will be largely unaffected by factors such as altitude in a tropical setting and that differences arising from a comparison are caused by bias in sampling. For example, no general trends emerged in size of butterflies with altitude in Costa Rica (Hawkins and DeVries, 1996). Two tests are carried out. First, a comparison is made of species from high and low altitude for size and wing pattern for a sub group of endemic species of conservation concern listed in Danielsen and Treadaway (2004). Second, we search for bias in abundance, size and wing pattern in Indang species in their discovery dates on Luzon and their dates of scientific naming. In the presence of biased recording for these attributes, we expect bias to affect both recording on Indang transects as well as during their initial discovery and naming over wider areas.
1.3 Statistical analysis
Comparisons (ANOVA, Mann Whitney U test), correlations (Spearman correlation, Gamma for datasets with numerous tied values), multiple stepwise regression, multivariate ordination of transect faunas (principal components analysis) have been conducted in STATISTICA (Statsoft, 1999). Variables to which parametric tests were applied were tested for normality; no transformations for date of discovery and date of scientific naming were necessary, but relative abundance was log10 transformed.
2 Results
2.1 Cumulative species richness
In all, 99 species were recorded on the three transect routes at Indang, that is, 10.9% of the Philippines fauna and 22.8% of the fauna for Luzon. A further six species were recorded in Metro Manila (some 39 species in all during visits to the conurbation) (Appendix 1). A plot of cumulative species distributions at Indang (Fig. 1) suggests that no limit is reached for any of the three transects; distance weighted least squares regression produces suitable fits and slopes of 0.57 (transect 1), 0.96 (transect 2) and 2.82 (transect 3). Even though one transect route has been surveyed on 364 days, and benches in cumulative species numbers occur (e.g. between surveys 30 and 54 on transect 1), the number of new species continues to rise at the end of the experiment on all transect routes. Incidence of species on transects follows the pattern typical of any area census, with many species found in very few transects and very few species found in the majority of transects (Fig. 2)
Species recorded on the three transect routes are significantly more abundant (F1,432 = 71.03, P < 0.00001) than those not found on transect routes but which occur on the island of Luzon (Fig. 3A).
2.2 Bias in transect records
Compared to species listed for the island of Luzon, the species recorded on the three Indang transects are biased for wing pattern but not size. Species recorded on transects are brighter and more apparent (F1,419 = 8.99, P = 0.003) than those not found on transects but which occur on Luzon (Fig. 3C). They are larger (Indang mean 2.61, Luzon residual species mean 2.40) but not significantly so (F1,398 = 1.54, P = 0.22) (Fig. 3B).
The species recorded on the three transect routes are also taxonomically biased with an excess of Papilionidae and Pieridae and a deficiency of Lycaenidae compared to taxa found on Luzon (c24 = 17.48, P = 0.002; Table 3). There are significant differences among Luzon butterfly taxa for abundance, size and wing pattern. Lycaenidae and Hesperiidae are less abundant (F4,429 = 2.70, P = 0.03), smaller (F4,395 = 177.03, P < 0.0001) and have less apparent wing patterns (F4,416 = 47.06, P < 0.0001) on average than Nymphalidae, Pieridae and Papilionidae (Fig. 4).
Species recorded during the surveys at Indang are those species which were found earlier historically on Luzon (U = 9810.5, Z = -6.16, P < 0.00001) as well as being the earliest to be named scientifically (U = 8622.5, Z = -7.05, P < 0.00001). Species discovery dates on Luzon correlate significantly with the abundance of and size of the species; in a stepwise multiple regression (forwards entry), more abundant and larger species were found significantly earlier (P < 0.0001) than less abundant and smaller species. There was no significant influence of wing pattern in the stepwise multiple regression (Table 4). Species scientific naming dates (not necessarily on the island) also correlate significantly (rs –0.22 to –0.39) with abundance and size and also with wing pattern (Table 4). Species discovery dates on Luzon and their naming dates differ significantly for taxa. Hesperiidae and Lycaenidae were discovered significantly later on average than Papilionidae, Pieridae and Nymphalidae (Table 5).
For both Luzon and the entire Philippine fauna larger species are also more distinctively patterned (Luzon, G = 0.26, P < 0.0001; Philippines, G = 0.24, P < 0.0001). This relationship is not repeated for Indang butterflies (G = 0.11, P = 0.44). For Luzon and the Philippines rarer species are also significantly smaller and duller in wing pattern (Luzon, size: G = 0.13, P = 0.007; wing pattern: G = 0.12, P = 0.01). This relationship is found for Indang species regarding size (G = 0.49, P = 0.0008) but not for wing pattern (G = 0.13, P = 0.39).
There is no distinction for size (U = 456.5, Z = -0.47, P = 0.64) or wing pattern (U = 452.5, Z = -0.54, P = 0.59) between low and high altitude butterflies for the sub-sample of endemic species listed in Danielsen and Treadway (2004).
2.3 Bias in timing of transect records
There is bias in timing of records on transects at Indang for abundance, wing pattern (colour) and size. The date of first observation correlates highly with mean relative abundance of species (incidence for surveys) taken over the three transects (rs = -0.72, P < 0.00001), a correlation that is maintained over each transect separately (P < 0.0001). Species observed earlier over the three transects tend to be more striking in wing pattern (Gamma = -0.19, P = 0.015) but smaller rather than larger than those recorded later on (Gamma = 0.16, P = 0.04).
There was no correlation between recording date on transects and the date of naming of species on Luzon (rs = 0.15, P = 0.13).
2.4 Contrasts for biodiversity among biotopes and localities.
Jackknife estimates of species richness for the three transect routes (with 95% confidence limits) were as follows: transect one, 86.8 ± 9.65 species; transect two, 99.8 ± 8.08 species and transect three, 68.7 ± 12.48 species; these compare with actual numbers of species observed of 69, 86 and 52 respectively.
Relative abundances among transects at Indang contrasted for three families, for Nymphalidae (F2,93 = 11.62, P = 0.00003), Lycaenidae (F2,66 = 6.12, P = 0.004) and Hesperiidae (F2,54 = 10.76, P = 0.0001). Abundances over families were consistently highest for transect route 2 and the order for all five families was transect 2 > transect 3 > transect 1. Scheffe post hoc tests revealed that for Nymphalidae and Hesperiidae, transect route 2 is distinguished from transect routes 1 and 3, and for Lycaenidae transect routes 1 and 2 are distinct but both are homogeneous with transect route 3.
A principal components analysis based on species relative frequencies for transects indicated a greater distinction between transect route 2 and transect routes 1 and 3 than between transect routes 1 and 3. The principal components analysis extracted two main axes accounting for 64.2% (eigenvalue 1.92) and 27.3% (eigenvalue 0.82) of the variance in species frequencies respectively (91.5% in all). Transect route 2 is distinguished from transect routes 1 and 3 on both axes (axis 1 loadings: transect one –0.86, transect two –0.59 and transect three –0.92; axis 2 loadings: transect one 0.40, transect two –0.80, transect three 0.14) and the two groups of transects are associated with different species. For instance, transect routes 1 and 3 are linked to high frequencies of Appias olferna and Zizina otis and transect route 2 with high frequencies of Papilio alphenor, Eurema hecabe, Leptosia nina, Cepora aspasia, Junonia hedonia, Ypthima stellera and Jamides cleodus.
3 Discussion
3.1 Factors influencing shortfalls in local butterfly species inventories in the tropics
Local butterfly species richness at Indang comprises a substantial fraction of regional species richness for the island of Luzon. To put it into perspective, the inventory of species for Indang includes some 23% of the fauna of Luzon, but the Indang survey zone occupies 0.02% of the land area of the island; in fact, the area directly surveyed along the transects represents <0.00008% of the area of the island (approximately 0.088 sq.km as against 104,683 sq.km (Peters, 1981). Higher fractional representation of a regional fauna by a single locality, than Indang of Luzon, is generally typical of impoverished or marginal environments, where many of the species comprise generalists and long distant migrants (e.g., British Isles) (Dennis, 2000, 2001) or areas of greater topographic diversity (Dennis, 1993). For instance, 146 butterfly species are recorded for Mt Makiling, Laguna (N14.07° E121.11°; 146 species) (Cayabyab, pers. comm.).
As it is, the local inventory is certainly incomplete. This is evident from several findings. First, a distinct feature of the cumulative species curves is an absence of an asymptote in untransformed axes, despite the large number of repeated surveys, 364 for Indang Village itself, over two years and covering seasonal changes in climate and vegetation phenology. The implication of the steep slopes for the regression equations is that further surveys will accumulate many additional species. Benches (plateaux) in the curves probably indicate seasonal effects in species flight times.
Second, distinct biases occur for species recorded at Indang in abundance, size, wing pattern and taxonomy. The first recording date of butterflies correlates significantly with their apparency (wing colour pattern and abundance). Butterflies recorded by the end of the survey at Indang are also a sample of the more abundant, physically more apparent (larger, bright wing pattern) butterflies found on Luzon. More Pieridae and Papilionidae are represented and fewer Lycaenidae than expected. The implication is that more Lycaenidae, at least, would be recorded with further sampling. That this finding indicates biased sampling and not just geographical variation is supported by three additional findings. (i) There is no distinction in size or colour pattern for high versus low altitude endemics in the Philippines. (ii) The same bias, as in recording at Indang, appears in the dates of discovery for species on Luzon and in the dates for scientific names for Luzon species. Species discovered later are less abundant, smaller, and with duller wing patterns. Similar findings were made for North American butterflies; larger and more widespread species were described earlier (Gaston et al. 1995). Lycaenidae are significantly less abundant, smaller and less striking in wing pattern. In other words, bias at the local scale mirrors processes in the discovery of species over the wider region. This bias may be reinforced by the positive correlation between abundance, size and wing pattern, at least at the scale of the Philippines and Luzon. What is particularly interesting is that Indang recording produces a deficit in Lycaenidae but no deficit in Hesperiidae despite the fact that they are less apparent and equally small. Hesperiidae are, however, more abundant (Fig. 4A) and perhaps more importantly may feed on lower vegetation and occupy lower strata and substrates than Lycaenidae. Lycaenidae may be under-recorded because they occupy the canopy. The recorder (PBH) was aware of species high in the canopy that he could not identify during transect recording. (iii) The final link is provided by the observation that species recorded at Indang are species that were also discovered earlier elsewhere (Papilionidae, Pieridae and Nymphalidae); Lycaenidae and Hesperiidae were discovered significantly later and all indications are that this is because they were less abundant and less apparent to naturalists discovering them.
Third, differences in species richness and diversity for transects may reflect distinctions in biotopes and not all biotopes are equally accessible to survey. The richness estimates for the three transect routes differ, particularly those for transect 2 and transect 3 whose 95% confidence limits do not overlap though transect 3 is suggested to be underestimated by the jackknife technique (see below). Although a wide range of biotopes was covered by the three transect routes at Indang (Table 2) each tended to concentrate recording on one particular biotope (transect 1, scrub and tall herbs; transect 2, secondary forest; transect 3, cultivated areas) (Table 2). Each vegetation type is likely to have associated with it if not unique species then larger populations of species elsewhere less common. This is demonstrated by comparisons for both diversity and relative abundances of taxa (families) at Indang: transect route 2 is consistently distinct from transect routes 1 and 3. Six additional species were observed in the more extreme urban setting of Metro Manila than Indang (Appendix 1) from casual visits; some of these were associated with exotic and ornamental vegetation (e.g., the Lycaenid Chilades pandava which feeds on Cycad palms). Also, even where access was available, it was not possible to survey the biotopes equally effectively and, as indicated above, canopy species – very possibly Lycaenidae - escaped identification.
All in all, the estimates from the Jackknife estimates are not unrealistic for transect routes 1 and 2, but would seem to greatly underestimate the potential numbers for transect route 3 the curve for which (Fig. 1), based on only 15 2h assessments, is rising as fast as that for transect route 2. The jackknife estimator of species usually tends to have a positive bias, that is, it tends to overestimate the number of species in a community (Heltshe and Forrester 1983). But, this bias is generally less than the negative bias of the observed number of species, which as a rule is always less than the true value of species richness in the community (Krebs, 1989). The current data for transect route 3 for which, based on few samples (n =15), a jackknife estimator is regarded as most suitable, here seems to provide a substantial underestimate of potential numbers of species. This is corroborated by the fact that the slope of the regression is substantially steeper for transect route 3 than transect routes 1 and 2. Clearly, techniques need to be advanced further to provide suitable estimates of diversity from faunal samples (see Hodkinson and Hodkinson, 1993).
3.2 Tropical environment context for Indang butterfly records
The Indang records support a number of recent findings on tropical butterfly faunas. First, they confirm the enormous diversity (richness) of butterfly faunas for small localities and in particular confirm that great diversity in arthropod communities occurs in managed as well as natural sites (Nummelin and Zilihona, 2004). The rising cumulative curve in butterfly species is similar in form to that for Neotropical butterflies (Sparrow et al. 1994).
Second, the records demonstrate that diversity can be equally large in substantially man-modified biotopes as well as in secondary forest; although differences occur among transect routes through different biotopes, these were not in orders of magnitude as can occur in the European landscape (Thomas, 1983). In a recent meta-analysis, Hill and Hamer (2004) reviewed the literature for the most frequently studied taxon (birds, 37 studies) and found increased and decreased diversity in response to disturbance (selective logging and shifting agriculture) were reported with equal frequency.
Third, Indang data generally also support Hill and Hamer’s further finding on diversity in primary and man-modified habitats. They point out that the spatial scale at which studies were carried out significantly affected the reported response to disturbance: studies where disturbed and undisturbed habitats were sampled at large spatial scales were more likely to report increased diversity following disturbance, whereas studies that sampled habitats at small spatial scales were more likely to report decreased diversity. These results were not a consequence of sampling method. Individually, the transect route with most secondary forest at Indang (Transect route 2) had the most species but collectively the different biotopes for the separate transect routes increase butterfly diversity.
Fourth, it is evident in the Indang data, nevertheless, that many forest species can spread out from forest areas into surrounding semi-natural biotopes and cultivated ground as in Costa Rica (Daily and Ehrlich, 1995). Examples include Papilio daedalus, Cepora aspasia, Pareronia valeria, Junonia spp, Hypolimnas bolina, Neptis mindorana, Spindasis syama. Despite this, the Indang data reveal differences in composition among forest biotopes and man-modified habitats in the aftermath of clearance; some notable differences in species composition (e.g., Papilio demoleus, Appias olferna, the migratory Pierids Catopsilia pomona, C. pyranthe and C. pomona, the non-arboreal Lycaenids including Lampides boeticus, Zizina otis, Zizeeria karsandra and Euchrysops cnejus) emerged in the principal components analysis of data for the transect routes. The Satyrine Ypthima stellera was equally abundant in the cleared habitats and in the forest, but the closely related Y. sempera only occurred in the forest.
Finally, the present work demonstrates the usefulness of transect observations as a technique for recording tropical butterflies. Where transects have been matched against collecting in a tropical context, as in Brazil, they have proved to be a suitable observation and data recording technique (Caldas and Robbins, 2003). However, the present study demonstrates that the issue of bias needs to be addressed as this can affect data from collecting as well as from observations. As it is, a combination of techniques needs to be further tested for recording butterflies in a tropical rain forest context, including trapping to record the canopy species (Sparrow et al. 1994). Based on the accumulation curves higher sampling effort is needed to get an accurate inventory of the most forested sites (Transect route 2), perhaps because of lack of apparency of the canopy species.
3.3 Challenges for conserving tropical butterflies
It is a well-understood axiom that what is not known cannot be easily conserved. The major setback to conserving tropical biodiversity is the lack of information as to where efforts should be concentrated (Howard et al. 1988). The Philippines have extraordinary biological diversity including the butterflies with 362 unique species (a total of 1079 including subspecies) found nowhere else (Treadaway 1995). The entire fauna is under serious threat from biotope loss (Danielsen and Treadaway, 2004). The country ranks high in terms of both deforestation and extent of deforested area (FAO, 2001) and unsurprisingly ranks among the world’s top priority countries for conservation (Myers et al., 2000). On top of this, some butterflies are under immense pressure from collecting (e.g., Papilio chikae “Luzon Peacock”, which only occurs on a few high mountains in the Banaue area, north Luzon).
Although data occur for a number of localities in the Philippines (Danielsen and Treadaway, 2004) it is rare for it to match the quality of that currently for Indang. Yet, even here, biased recording influences the data. The lack of a limit emerging in butterfly species cumulative curves for Indang suggests that (1) the survey period was not long enough, and (2) butterfly species are not equally detectable or unevenly distributed. If a well-known and highly apparent group like the butterflies has substantial problems with apparency during detailed surveys, how much more pronounced the deficit of knowledge is likely to be for the documentation and conservation of less apparent, less well-known taxa. Even when records are available for localities their status as resident breeding species or vagrants is difficult to interpret (Dennis, 2000). As it is, the species list in some respects represents a dynamic equilibrium; the longer the period over which data are collected, the more likely it is that some of the ‘earlier’ species may truly disappear and ‘later’ species represent new additions (Dennis, 2000). Unfortunately, collectors rarely spend time to observe their quarry and fail to publish their observations. The current work demonstrates that much valuable data can be accumulated on tropical butterflies without killing them (Lafranchis 2004).
The need for information on ecology of butterflies cannot be overemphasised (Daily and Ehrlich, 1995). The sheer loss of biotopes makes this an urgent issue. Deforestation in tropical rain forests leads to catastrophic butterfly extinctions as in Singapore (Brook et al. 2003). Indications are that the unprecedented rate of habitat destruction in SE Asia will result in 13% – 42% loss of regional populations over the next century, half of which will be global extinctions (Brook et al. 2003). Such destruction generates an urgent need to understand the impacts of anthropogenic habitat disturbance on biodiversity in tropical rain forests. As yet no consensus has yet emerged (Hill and Hamer, 2004). Although logging and clearance may not result in systematic changes in species richness they do have an impact on faunal composition. For instance, species with shade preferences (e.g., Satyrinae and Morphinae) were most affected by logging in Borneo (Hamer et al. 2003). Furthermore, logging tends to produce a distinctive gap fauna, of more widespread, mobile species (Hill et al 2001). The current paper indicates how extremely valuable information on butterfly diversity can be acquired using relatively simple techniques and we urge the rapid collection of such data. Where butterfly records are linked to behaviour, substrate use and biotopes (Dennis 2004), they especially enhance our knowledge of butterfly biology and provide valuable tools for conservation.
Acknowledgements We are grateful to Drs Tim H. Sparks and Tim G. Shreeve for statistical advice, to two anonymous referees and to Professor I.D. Hodkinson for helpful comments on an earlier version of the paper, and to Dr B. F. Cayabyab for his observations on Mt Makiling. Phillip M. Kinder very kindly coded the wing patterns.
References
Asher J, Warren M, Fox R, Harding P, Jeffcoate G, Jeffcoate S, 2001. The Millennium Atlas of Butterflies in Britain and Ireland. Oxford: Oxford University Press.
Brook, BW, Sodhi NS, Ng PKL, 2003. Catastrophic extinctions follow deforestation in Singapore. Nature 424: 420 – 423.
Caldas A, Robbins RK, 2003. Modified Pollard transects for assessing tropical butterfly abundance and diversity. Biol. Conserv. 110: 211 – 219.
Cook LM, Dennis RLH, Hardy PB, 2002. Butterfly-hostplant fidelity, vagrancy and a measurement of mobility from distribution maps. Ecography 24: 497-504.
Cowley MJR, Thomas CD, Roy DB, Wilson RJ, León-Cortés JL, Gutierrez D, Bulman CR, Quinn RM, Moss D, Gaston KJ, 2001. Density-distribution relationships in British butterflies. I. The effect of mobility and spatial scale. J. Anim. Ecol. 70: 410-425. D’Abrera B, 1981-1986. Butterflies of the Oriental Region (3 vols). Melbourne: Hill House.
Daily GC, Ehrlich PR, 1995. Preservation of biodiversity in small rain-forest patches rapid evaluations using butterfly trapping. Biodivers. Conserv. 4: 35 – 55.
Danielsen F, Treadaway CG, 2004. Priority conservation areas for butterflies (Lepidoptera: Rhopalocera) in the Philippine islands. Anim. Conserv. 7: 79 – 92.
Davis BNK, 1989. Habitat creation for butterflies in a landfill site. Entomol. 108: 109 – 122.
De Jong R, Treadaway CG, 1993. Hesperiidae of the Philippines. Frankfurt: NEVA. Dennis RLH, ed. 1992. The Ecology of Butterflies in Britain. Oxford: Oxford University Press.
Dennis RLH, 1993. Butterflies and Climate Change. Manchester: Manchester University Press.
Dennis RLH, 2000. Contrasts in status of butterfly species among open and woodland biotopes of a northern English SSSI. Ent. Gaz. 51: 257-273.
Dennis RLH, 2001. Progressive bias in species status is symptomatic of fine-grained mapping units subject to repeated sampling. Biodivers. Conserv. 10: 483-494.
Dennis RLH, 2004. Butterfly habitats, broad scale biotope affiliations and structural exploitation of vegetation at finer scales: the matrix revisited. Ecol. Entomol. 29: 744-752.
Dennis RLH, Shreeve TG, van Dyck H, 2003. Towards a resource-based concept for habitat: a butterfly biology viewpoint. Oikos 102: 417-426.
Dennis RLH, Hodgson JG, Grenyer R, Shreeve TG, Roy DB, 2004. Host plants and butterfly biology. Do host plant strategies drive butterfly status? Ecol. Entomol. 29: 12-26. Eliot JN, 1992. The Butterflies of the Malay Peninsula. Corbet & Pendlebury. 4th ed. Malayan Nature Society, 1992.
Gaston KJ, Blackburn TM, Loder N, 1995. Which species are described first?: the case of North American butterflies. Biodiv. Conserv. 4: 119 – 127.
Hamer KC, Hill JK, Benedick S, Mustaffa N, Sherratt TN, Maryati M, Chey VK, 2003. Ecology of butterflies in natural and selectively logged forests of northern Borneo: the importance of habitat heterogeneity. J. Appl. Ecol. 40: 150 – 162. Hawkins BA, DeVries PJ, 1996. Altitudinal gradients in the body sizes of Costa Rican butterflies. Acta Oecol.-Int. J. Ecol. 17: 185 – 194.
Heltshe JF, Forrester NE, 1983. Estimating species richness using the jackknife procedure. Biometrics 39: 1 – 11.
Hill JK, Hamer KC, Tangah J, Dawood M, 2001. Ecology of tropical butterflies in rainforest gaps. Oecologia 128: 294 – 302.
Hill JK, Hamer KC, 2004. Determining impacts of habitat modification on diversity of tropical forest fauna: the importance of spatial scale. J. Appl. Ecol., 41: 744 – 754.
Hodkinson ID, Hodkinson E, 1993 Pondering the imponderable: a probability-based approach to estimating insect diversity from repeat faunal samples. Ecol. Entomol. 18: 91-92.
Howard PC, Viskanic P, Davenport TRB, Kigenyi FW, Baltzer M, Dickinson CJ, Lwanga JS, Matthews RA, Balmford A, 1998. Complementarity and the use of indicator groups for reserve selection in Uganda. Nature 394: 472 – 475.
Krebs CJ, 1989. Ecological methodology. London: Harper Collins Publishers.
Lafranchis T, 2004. Butterflies of Europe. Paris: Diatheo. Myers N, Mittermeier RA, Mittermeier CG, da Fonseca GAB, Kent J, 2000. Biodiversity hotspots for conservation priorities. Nature 403: 853-858.
New TR, 1997. 2nd edition. Butterfly Conservation. Oxford: Oxford University Press.
Nummelin M, Zilihona IJE, 2004. Spatial variation of arthropod communities in virgin and managed sites in the Kibale Forest, western Uganda. For. Ecol. Manage. 195: 107 – 114.
Peters J, 1981. Philippines. Hawthorn, Australia: Lonely Planet.
Pollard E, Yates TJ, 1993. Monitoring butterflies for ecology and conservation. London: Chapman & Hall.
Sparrow HR, Sisk TD, Ehrlich PR, Murphy DD, 1994. Techniques and guidelines for monitoring Neotropical butterflies. Conserv. Biol. 8: 800- 809.
Statsoft, 1999. STATISTICA for Windows 95/98/NT. Tulsa.
Stefanescu C, Peñuelas J, Filella I, 2003. Effects of climatic change on the phenology of butterflies in the northwest Mediterranean Basin. Global Change Biol.. 9: 1494-1506.
Treadaway CG, 1995: Checklist of the butterflies of the Philippine Islands (Lepidoptera: Rhopalocera). In Nässig WA and Settele J eds Beiträge zur Kenntnis der Lepidoptera der Philippinen, II. Contributions to the knowledge of the Lepidoptera of the Philippines. Frankfurt: NEVA, supplement 14.
Thomas JA, 1983. A ‘Watch’census of common British butterflies. J. Biol. Educ. 17: 333 –338.
Williamson M, Gaston KJ, Lonsdale WM 2001. The species-area relationship does not have an asymptote! J. Biogeogr. 28: 827 – 830.
Tables
Table 1 The number of butterfly species found in the Philippines, the main island Luzon and at Indang, site of three transects.
|
Family |
Subfamily |
Philippines1 |
Luzon |
Indang |
|
1 Papilionidae |
1.1 Papilioninae |
58 |
27 |
11 |
|
2 Pieridae |
2.1 Coliadinae |
15 |
11 |
7 |
|
2 Pieridae |
2.2 Pierinae |
43 |
25 |
7 |
|
3 Nymphalidae |
3.1 Nymphalinae |
147 |
65 |
16 |
|
3 Nymphalidae |
3.2 Charaxinae |
16 |
7 |
0 |
|
3 Nymphalidae |
3.3 Morphinae |
15 |
4 |
1 |
|
3 Nymphalidae |
3.4 Satyrinae |
70 |
29 |
9 |
|
3 Nymphalidae |
3.5 Danainae |
36 |
25 |
6 |
|
3 Nymphalidae |
3.6 Libytheinae |
3 |
2 |
0 |
|
4 Lycaenidae |
4.1 Poritiinae |
23 |
6 |
0 |
|
4 Lycaenidae |
4.2 Liphyrinae |
1 |
1 |
0 |
|
4 Lycaenidae |
4.3 Miletinae |
30 |
12 |
2 |
|
4 Lycaenidae |
4.4 Curetinae |
2 |
1 |
0 |
|
4 Lycaenidae |
4.5 Lycaeninae |
282 |
137 |
21 |
|
4 Lycaenidae |
4.6 Riodininae |
10 |
3 |
0 |
|
5 Hesperiidae |
5.1 Coeliadinae |
23 |
15 |
0 |
|
5 Hesperiidae |
5.2 Pyrginae |
28 |
12 |
2 |
|
5 Hesperiidae |
5.3 Hesperiinae |
105 |
53 |
17 |
|
|
|
907 |
435 |
99 |
1 List as in 1995; the list is unstable with new species being added continuously.
|
|
|
|
Table 2 Site descriptions of three transects in the vicinity of Indang Village
|
Transect |
Transect length/time1 |
Surveys (days) |
Tree cover2 (%) |
Scrub cover (%) |
Cultivation (%) |
Gardens/Parks (%) |
Roads and buildings (%) |
|
1 Indang village |
800m/30min |
364 |
5 |
70 |
5 |
10 |
10 |
|
2 Forest north-east of Indang village |
5km/2h |
65 |
40 |
20 |
40 |
0 |
<1 |
|
3 Farmland west of Indang village |
3km/1h |
28 |
15 |
15 |
25 |
25 |
20 |
1 The maximum distance between transect routes is 4 km. 2 Tree cover forms part of secondary forest or ‘gubat’.
Table 3 Taxonomic comparison (for butterfly families) of species recorded on three Indang transect routes with those listed for Luzon but not found on the three transect routes at Indang.
|
Location |
Papilionidae |
Pieridae |
Nymphalidae |
Lycaenidae |
Hesperiidae |
Total |
|
Luzon (residual) |
15 (- 5.86) |
23 (- 4.81) |
100 (-1.96) |
137 (13.41) |
61 (-0.79) |
336 |
|
Indang |
12 (+ 5.86) |
13 (+ 4.81) |
32 (+ 1.96) |
23 (- 13.41) |
19 (+ 0.79) |
99 |
|
Total |
27 |
36 |
132 |
160 |
80 |
435 |
The comparison is standardised across transect routes for survey time. The figures in brackets indicate differences in numbers of species from expectations.
Table 4 Stepwise multiple regression (forwards entry) of find date and scientific naming of Luzon butterfly species with abundance, size and wing pattern.
|
Dependent variable |
Predictor variables |
B |
SEB |
P |
R2 |
|
Find date on Luzon |
Intercept |
1995.4 |
9.98 |
<0.00001 |
|
|
Abundance |
-27.44 |
2.79 |
<0.00001 |
19.9 | |
|
Wing size |
-7.01 |
1.68 |
0.00004 |
3.4 | |
|
Date of scientific name |
Intercept |
1949.2 |
11/47 |
<0.00001 |
|
|
Abundance |
-18.30 |
2.93 |
<0.00001 |
9.8 | |
|
Wing size |
-7.23 |
1.82 |
0.00008 |
5.1 | |
|
Wing pattern |
-6.29 |
2.24 |
0.005 |
1.7 |
Find date: F2,396 = 59.99 R = 0.48, R2 = 23.3%, P < 0.00001; wing pattern was not entered into the equation for find date on Luzon.
Date of scientific naming: F3,393 = 25.99, R = 0.41, R2 = 16.6%, P < 0.00001.
Table 5 Comparison of dates of discovery and scientific naming of Luzon species for different butterfly families using ANOVA
|
|
|
|
|
Confidence limits |
| |
|
Comparison |
Family |
Mean date |
Date standard error |
-95.00% |
+95.00% |
N |
|
Discovery date on Luzon1 |
Papilionidae |
1870.4 |
10.42 |
1849.9 |
1890.9 |
27 |
|
Pieridae |
1880.0 |
9.03 |
1862.3 |
1897.7 |
36 | |
|
Nymphalidae |
1875.3 |
4.71 |
1866.0 |
1884.6 |
132 | |
|
Lycaenidae |
1909.1 |
4.28 |
1900.6 |
1917.5 |
160 | |
|
Hesperiidae |
1902.0 |
6.06 |
1890.1 |
1913.9 |
80 | |
|
Date of scientific naming2 |
Papilionidae |
1837.5 |
10.49 |
1816.9 |
1858.1 |
27 |
|
Pieridae |
1833.2 |
9.35 |
1814.9 |
1851.6 |
34 | |
|
Nymphalidae |
1838.8 |
4.76 |
1829.5 |
1848.2 |
131 | |
|
Lycaenidae |
1874.0 |
4.35 |
1865.5 |
1882.6 |
157 | |
|
Hesperiidae |
1877.7 |
6.09 |
1865.7 |
1889.6 |
80 | |
1Dates of discovery for species on Luzon: F4, 430 = 9.29, P < 0.00001.
2Date of scientific naming of species occurring on Luzon: F4, 424 = 12.75, P < 0.00001
Figure legends
Fig. 1 Cumulative species curves for three transects at Indang, Luzon. Open circles, transect 1 r = 0.97, n= 92; open squares, transect 2 r = 0.94, n = 66; black triangles, transect 3 r = 0.98, n= 15; all P < 0.00001.
Fig. 2 Incidence of species on Indang transects (% incidence over 457 transects; means for 3 transect routes).
Fig. 3 Comparative distribution of scores for abundance, size and wing pattern for Indang butterflies and the remaining butterflies found on Luzon. A. Abundance: Luzon (mean ± SE) 3.0 ± 0.050, Indang 3.8 ± 0.047***; B. Size: Luzon 2.40 ± 0.082, Indang 2.61 ± 0.151 NS; C. Wing pattern colour: Luzon 2.83 ± 0.063, Indang 3.23 ± 0.128**. NS not significant, * P < 0.05, ** P < 0.01, *** P < 0.001
Fig. 4 Comparative distribution of scores for abundance, size and wing pattern colour for butterfly families on the island of Luzon. A. Abundance: Papilionidae (mean ± standard error) 3.41 ± 0.144, Pieridae 3.33 ± 0.154, Nymphalidae 3.30 ± 0.073, Lycaenidae 3.01 ± 0.074, Hesperiidae 3.19 ± 0.101*; B. Size: Papilionidae 5.04 ± 0.259, Pieridae 2.91 ± 0.147, Nymphalidae 3.50 ± 0.101, Lycaenidae 1.39 ± 0.047, Hesperiidae 1.64 ± 0.076***; C. Wing pattern colour: Papilionidae 3.67 ± 0.160, Pieridae 4.85 ± 0.077, Nymphalidae 2.93 ± 0.097, Lycaenidae 2.73 ± 0.068, Hesperiidae 2.23 ± 0.138***. * P < 0.05, ** P < 0.01, *** P < 0.001.
Figures
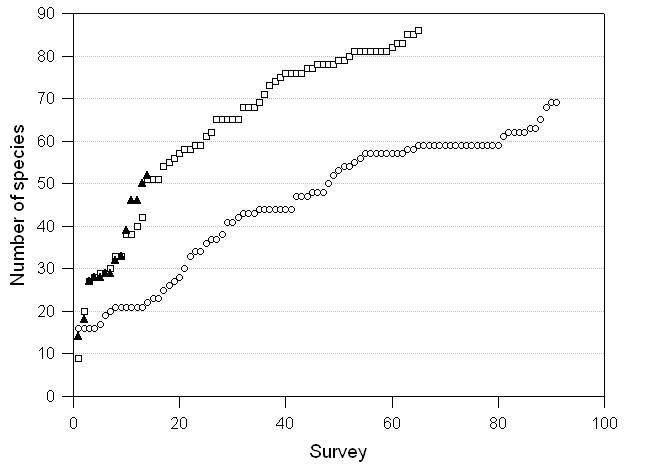
Fig. 1
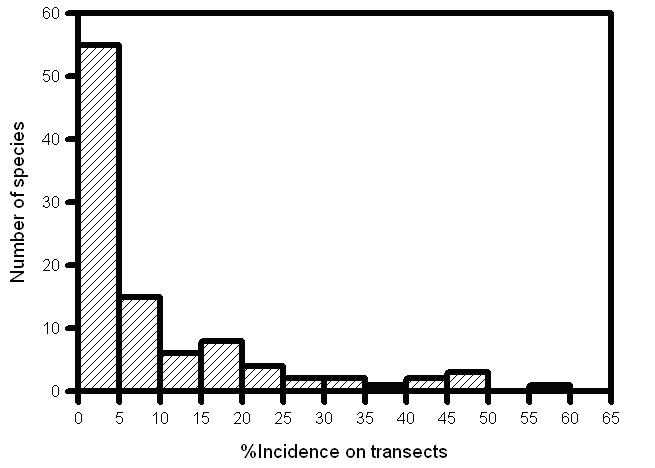
Fig. 2
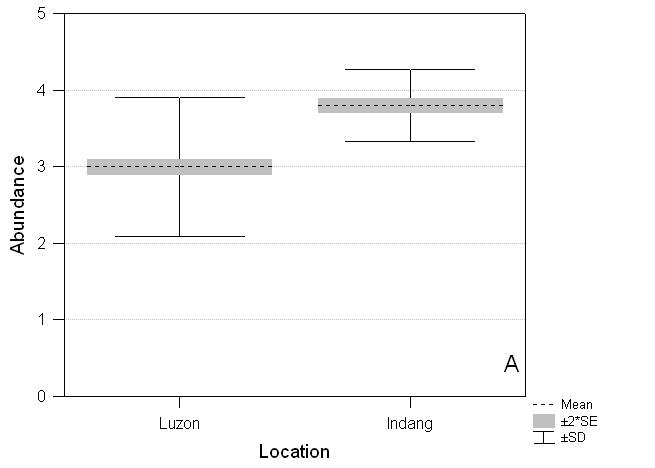
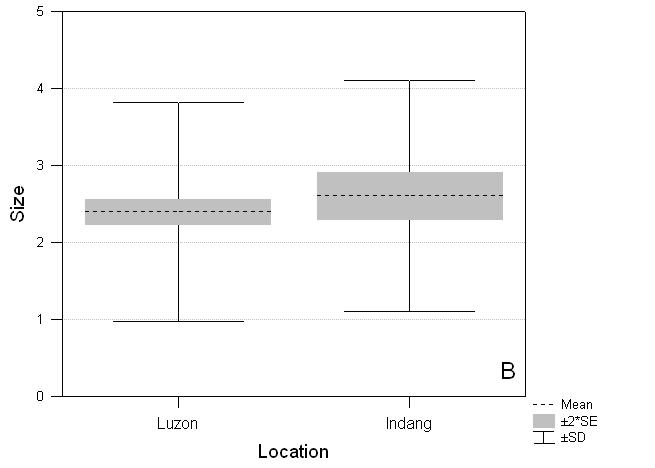
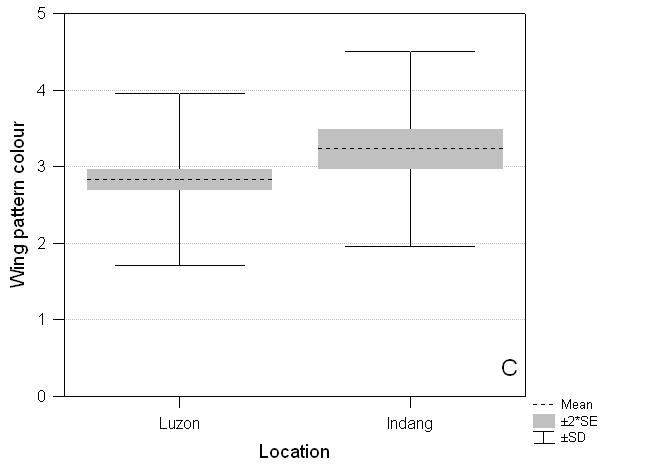
Fig. 3
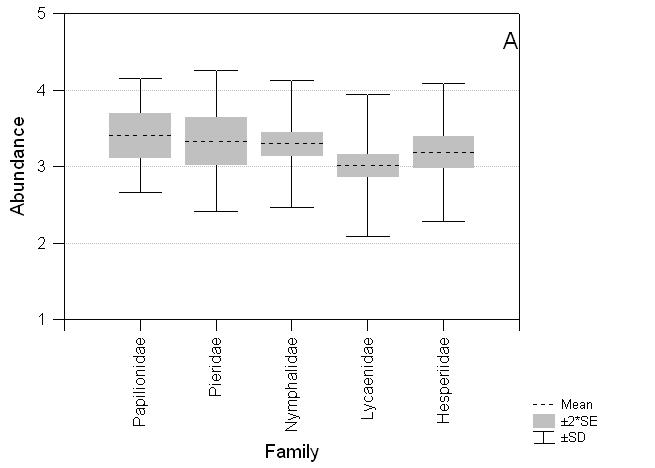
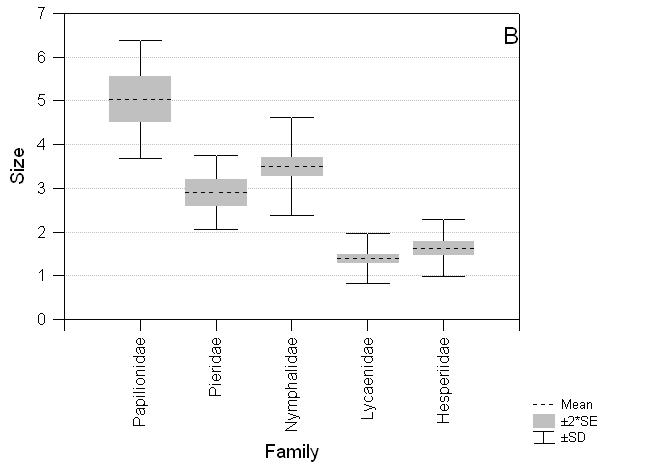
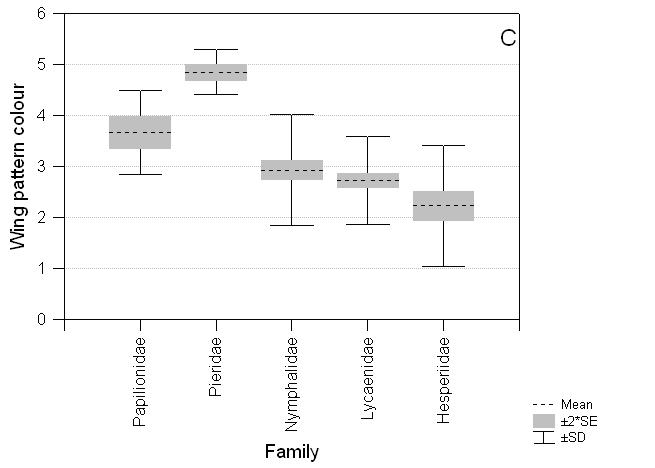
Fig. 4
Appendix 1 List of species recorded on transects (incidence) at Indang village, Luzon
|
Species |
Subfamily |
Family |
Transect 1 |
Transect 2 |
Transect 3 |
|
Troides rhadamanthus |
1.1 |
1 |
2 |
4 |
0 |
|
Pachliopta kotzebuea |
1.1 |
1 |
5 |
2 |
6 |
|
Chilasa clytia |
1.1 |
1 |
6 |
19 |
4 |
|
Papilio demoleus |
1.1 |
1 |
113 |
9 |
4 |
|
Papilio hytaspes |
1.1 |
1 |
2 |
0 |
0 |
|
Papilio daedalus |
1.1 |
1 |
3 |
2 |
0 |
|
Papilio alphenor |
1.1 |
1 |
56 |
41 |
6 |
|
Papilio rumanzovia |
1.1 |
1 |
8 |
6 |
3 |
|
Graphium sarpedon |
1.1 |
1 |
3 |
1 |
0 |
|
Graphium doson |
1.1 |
1 |
1 |
1 |
0 |
|
Graphium agamemnon |
1.1 |
1 |
6 |
15 |
4 |
|
Graphium euphrates |
2.1 |
2 |
8 |
14 |
2 |
|
Catopsilia pyranthe |
2.1 |
2 |
35 |
7 |
4 |
|
Catopsilia pomona |
2.1 |
2 |
21 |
4 |
3 |
|
Catopsilia scylla |
2.1 |
2 |
76 |
16 |
5 |
|
Gandaca harina |
2.1 |
2 |
0 |
1 |
0 |
|
Eurema hecabe |
2.1 |
2 |
128 |
59 |
13 |
|
Eurema sarilata |
2.1 |
2 |
0 |
6 |
0 |
|
Delias henningia |
2.2 |
2 |
0 |
3 |
0 |
|
Leptosia nina |
2.2 |
2 |
107 |
52 |
11 |
|
Cepora aspasia |
2.2 |
2 |
17 |
46 |
11 |
|
Appias olferna |
2.2 |
2 |
140 |
16 |
20 |
|
Appias lyncida |
2.2 |
2 |
1 |
12 |
1 |
|
Appias nephele |
2.2 |
2 |
0 |
1 |
0 |
|
Pareronia boebera |
2.2 |
2 |
14 |
42 |
4 |
|
Cethosia biblis |
3.1 |
3 |
2 |
1 |
0 |
|
Phalanta phalantha |
3.1 |
3 |
7 |
7 |
0 |
|
Symbrenthia hippoclus |
3.1 |
3 |
0 |
1 |
0 |
|
Junonia hedonia |
3.1 |
3 |
34 |
52 |
15 |
|
Junonia atlites |
3.1 |
3 |
1 |
0 |
0 |
|
Junonia almana |
3.1 |
3 |
8 |
15 |
5 |
|
Junonia lemonias |
3.1 |
3 |
11 |
6 |
0 |
|
Yoma sabina |
3.1 |
3 |
0 |
1 |
0 |
|
Hypolimnas anomala |
3.1 |
3 |
2 |
0 |
2 |
|
Hypolimnas misippus |
3.1 |
3 |
0 |
0 |
1 |
|
Hypolimnas bolina |
3.1 |
3 |
32 |
21 |
6 |
|
Doleschallia bisaltide |
3.1 |
3 |
1 |
10 |
0 |
|
Cyrestis maenalis |
3.1 |
3 |
6 |
32 |
1 |
|
Pantoporia dama |
3.1 |
3 |
1 |
18 |
1 |
Lasippa illigera |
3.1 |
3 |
1 |
2 |
0 |
|
Neptis mindorana |
3.1 |
3 |
1 |
42 |
7 |
|
Amathusia phidippus |
3.3 |
3 |
9 |
1 |
0 |
|
Melanitis leda |
3.4 |
3 |
24 |
4 |
0 |
|
Zethera pimplea |
3.4 |
3 |
0 |
6 |
0 |
|
Lethe europa |
3.4 |
3 |
0 |
0 |
1 |
|
Ptychandra lorquinii |
3.4 |
3 |
0 |
4 |
0 |
|
Mycalesis ita |
3.4 |
3 |
0 |
7 |
0 |
|
Mycalesis mineus |
3.4 |
3 |
28 |
26 |
2 |
|
Mycalesis igoleta |
3.4 |
3 |
5 |
21 |
0 |
|
Ypthima stellera |
3.4 |
3 |
114 |
51 |
10 |
|
Ypthima sempera |
3.4 |
3 |
0 |
36 |
1 |
|
Ideopsis juventa |
3.5 |
3 |
15 |
23 |
5 |
|
Tirumala limniace |
3.5 |
3 |
5 |
31 |
4 |
|
Danaus chrysippus |
3.5 |
3 |
1 |
0 |
0 |
|
Danaus melanippus |
3.5 |
3 |
0 |
2 |
2 |
|
Euploea swainson |
3.5 |
3 |
0 |
1 |
0 |
|
Euploea mulciber |
3.5 |
3 |
1 |
4 |
1 |
|
Allotinus fallax |
4.3 |
4 |
3 |
2 |
0 |
|
Spalgis epius |
4.3 |
4 |
4 |
0 |
0 |
|
Nacaduba sanaya |
4.5 |
4 |
0 |
1 |
0 |
|
Nacaduba beroe |
4.5 |
4 |
3 |
17 |
0 |
|
Prosotas nora |
4.5 |
4 |
0 |
4 |
1 |
|
Prosotas dubiosa |
4.5 |
4 |
6 |
7 |
2 |
|
Catopyrops ancyra |
4.5 |
4 |
1 |
0 |
0 |
|
Caleta roxus |
4.5 |
4 |
1 |
25 |
2 |
|
Jamides celeno |
4.5 |
4 |
0 |
2 |
0 |
|
Jamides alecto |
4.5 |
4 |
1 |
0 |
0 |
|
Jamides cleodus |
4.5 |
4 |
82 |
37 |
6 |
|
Jamides suidas |
4.5 |
4 |
2 |
2 |
1 |
|
Catochrysops strabo |
4.5 |
4 |
1 |
11 |
1 |
|
Lampides boeticus |
4.5 |
4 |
33 |
7 |
1 |
|
Zizeeria karsandra |
4.5 |
4 |
1 |
6 |
3 |
|
Zizina otis |
4.5 |
4 |
171 |
20 |
15 |
|
Zizula hylax |
4.5 |
4 |
4 |
9 |
3 |
|
Everes lacturnus |
4.5 |
4 |
0 |
3 |
0 |
|
Euchrysops cnejus |
4.5 |
4 |
33 |
27 |
6 |
|
Spindasis syama |
4.5 |
4 |
5 |
16 |
1 |
|
Arhopala pseudocentaurus |
4.5 |
4 |
0 |
2 |
0 |
|
Remelana jangala |
4.5 |
4 |
1 |
0 |
0 |
|
Hypolycaena erylus |
4.5 |
4 |
0 |
3 |
0 |
|
Tagiades japetus |
5.2 |
5 |
1 |
6 |
1 |
|
Odontoptilium angulatum |
5.2 |
5 |
0 |
3 |
0 |
|
Aeromachus plumbeola |
5.3 |
5 |
0 |
0 |
1 |
|
Halpe luteisquama |
5.3 |
5 |
0 |
7 |
3 |
|
Psolos fuligo |
5.3 |
5 |
0 |
1 |
0 |
|
Ancistroides nigrita |
5.3 |
5 |
0 |
2 |
0 |
|
Notocrypta paralysos |
5.3 |
5 |
1 |
4 |
0 |
|
Notocrypta feisthamelii |
5.3 |
5 |
0 |
2 |
0 |
|
Xanthoneura telesinus |
5.3 |
5 |
0 |
1 |
0 |
|
Erionota thrax |
5.3 |
5 |
2 |
1 |
0 |
|
Taractrocera luzonensis |
5.3 |
5 |
52 |
18 |
5 |
|
Oriens californica |
5.3 |
5 |
0 |
6 |
1 |
|
Potanthus pava |
5.3 |
5 |
0 |
10 |
1 |
|
Telicota augias |
5.3 |
5 |
2 |
4 |
0 |
|
Cephrenes acalle |
5.3 |
5 |
1 |
5 |
1 |
|
Prusiana prusias |
5.3 |
5 |
2 |
1 |
0 |
|
Parnara kawazoei |
5.3 |
5 |
0 |
0 |
1 |
|
Borbo cinnara |
5.3 |
5 |
1 |
0 |
0 |
|
Pelopidas mathias |
5.3 |
5 |
2 |
10 |
0 |
Nomenclature after Danielsen and Treadaway (2004). Families and subfamilies, see number coding in Table 1. Numbers under Transect 1 to Transect 3 indicate the number of occasions species have been observed on transects. Six additional species were recorded in Metro Manila: Junonia orithya, Mycalesis perseus, Chilades pandava, Hypolycaena sipylus, Badamia exclamationis and Tagiades trebellius.